Android Studio 3.2 is Here: Let’s Dig into its Pivotal Features
- Updates
- September 26, 2018
It seems Google is in full swing. The story of a series of releases began with Android Pie, and then came the Google Flutter Preview 2 and now Google has launched the stable version of Android Studio 3.2, which you can start downloading.
With this unroll; it would be more than convenient for the developers to develop the Android App Bundle using the newly used OS version, the Android P. In fact, Google had announced about the unveiling of Android Studio 3.2 way before at its I/O conference 2018.
However, this time round it has released a set of 20 new features, focusing on improvement of quality and refining its functionality.
As already indicated, the developers will find it much easier to deal with the Android App Bundle, which is the new app publishing format. They can create a bundle with least of the efforts. Even the task of smaller optimized app distribution has become simplified.
You just have to upload the app bundle to the Google Play Store, that’s it. Indeed, the Android app developers have already started to witness the reduction in app size ranging between 11 to 64% by employing the app bundles to APK app size.
So, let’s down to the 20 newly introduced features in the Android Studio 3.2 and discuss each of these in some brief. However, before that we would be commencing with the two most important features of the new version of Android Studio, i.e. Android Emulator Snapshots and the Energy Profiler.
Android Emulator Snapshots
The Android Emulator Snapshots has been introduced by Google to help the developers to capture the picture or the snapshot of the recent state of the emulator at a faster pace. Precisely it involves the latest screenshot including the apps and settings.
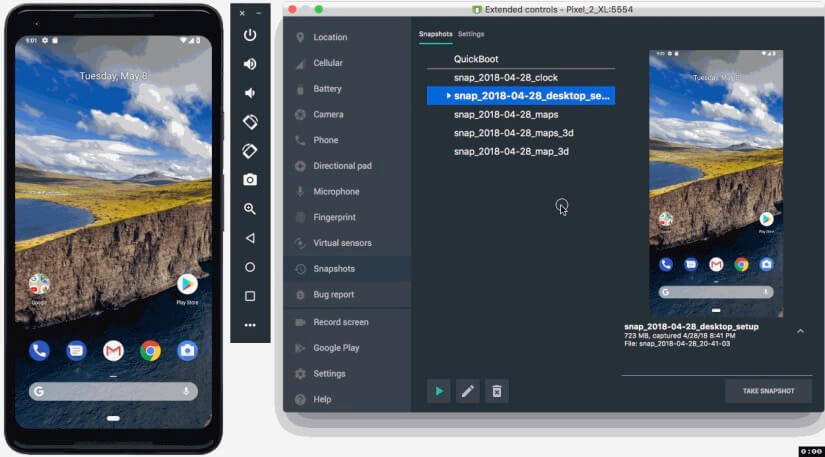
And the most interesting part is that it allows you to continue or even boot your emulator within a couple of seconds. Therefore, if you are looking to accelerate the speed of test run or go for much quicker boot using the Android Emulator Snapshots is the feature to bank upon.
Energy Profiler
One of the other vital features that have made its inception in Android 3.2 is the Energy Profiler. As the name suggests, this feature is evidently helpful in boosting the energy strips of your app through a set of tools.
In fact, it would also support in improving the battery life of the device. The Energy profiler will help developers trace the energy consumption of their apps, effectively managing the power consumption of apps in different scenarios.
The Android Studio 3.2 will also lend a helping hand when you want to work out with the advanced technologies including the Android Jetpack, Android Slices, and Artificial Intelligence (AI).
Sample Data
Using this feature the developer can utilize the placeholder data, which would precisely help him out in designing the app. As such, you can visualize the layout design that relies on the runtime data.
If you want to get more views, then it would be viable to add the built-in sample data. A few examples include ImageViews, TextViews, or the RecyclerViews etc. The sample data can be added through a popup window in the Layout Editor.
Material Design Update
During the relocation from the Android Design, support library to the new MaterialComponents app theme, and library, the developer is liable to have an access to the new and updated widgets like cards, text fields, button cards, BottomAppBar, and developers now can easily migrate from old library to new AndroidX packages with the refactoring tools.
Slices Support
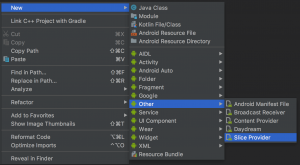
Android Studio gets built in template to add Slices Support to your project. It would help to surface the app content in Google search as the Google Assistant. This makes it convenient to opt for the app expansion with the support of new Slice Provider APIs and new lint checking.
Here first you have to right click on the project and then browse the New→ Other→ Slice Provider.
CMakeList Editing Support
If you are employing the C or C++ programming languages to create the apps, you will now get a much better support for CMake. The CMakeList build script command will get you the access for working on code completion and syntax highlighting; all thanks to the Android Studio 3.2 new version.
The New Assistant
Google in the Android Studio 3.2 has offered a new Assistant panel that opens automatically once the update is completed. It also provides the vital information about the changes occurred in the IDE (Integrated Development Environment).
In addition, you can open the Assistant panel by choosing the help option.
AndroidX Refactoring Support
The AndroidX is usually the extension libraries that are regarded as one of the key elements for the Android Jetpack. It is often used as a substitute for the Android Support Libraries. If you are looking to add the AndroidX to a new project, then add android.useAndroidX=true to the gradle.properties file.
However, if you are willing to migrate your project to new namespace and dependencies, then you have another option which is built-in refactoring action.
Alternatively, in case you have Maven dependencies, not migrated to the AndroidX namespace, the concerned project dependencies get converted automatically by the build system.
What about Kotlin
Kotlin 1.2.61 brings extensive support for the Kotlin friendly Android 9 Pie SDK.
IntelliJ Platform Update
Google has also introduced the IntelliJ 2018.1.6 platform, which would help to improve the debugging, the dataflow analysis, and inspections including inline external annotations, partial Git commits and so on.
Android App Bundle
We have pointed out earlier that Google brought forward the Android App Bundle with the aim of offering smaller APKs to the users thereby reducing the download size of the app. Google also has got a new serving model better known as the Dynamic model, which helps in processing the app bundle and develop as well as deliver best optimized APKs to each of the user’s device configuration.
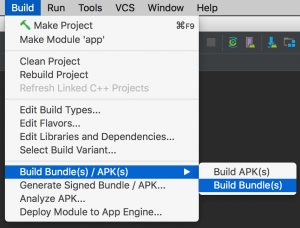
This would help developers download only the code and resources needed to run the app on their device. The Android 3.2 or the command line allows you to develop your code as the app bundle so that you can maximize the advantages of smaller APKs that are related to the screen density, language, and ABIs. As such, you don’t have to make any changes in the code.
R8 Optimizer
Android Studio 3.2 has undergone a change with employing the R8 as a substitution for ProGuard so as to optimize and shrink the Java language bytecode. However, R8 is still on the trial basis and so it’s better not to use it for the app publishing purpose.
D8 Desugaring
Sometimes you need to use new Java language features. But the earlier Android phone models do not support these features. So, this is where the Desugaring would come to the rescue allowing you to implement these features even on the older devices.
In order to achieve this it will substitute the new bytecodes and language APIs with the previous ones when building the app. The D8 Desugaring gets turned on by default so that it becomes easier for using the latest language changes for the older phones.
Microsoft Hyper-V Support
Google has offered additional facility to the users using Windows 10 on their PC by allowing them to run the Android Emulator faster with Hyper-V support. In fact, the Intel HAXM is still considered as the fastest Android Emulator, which is a default hypervisor.
Significantly, even the Microsoft has played an important role as an open-source contributor, adding the new Windows Hypervisor Platform (WHPX) API helping the Android Emulator to jointly stay with the Hyper-V-backed applications such as local virtual machines taking the Hyper-V Support.
Screen Record in Android Emulator
The recording facilities of both screen as well as the audio are now available across any of the API level. This is due to the fact that Google has rolled out with screen record feature in the Android Emulator.
The latest version of the Emulator, v28.0+ is not just restricted to recoding of the screen on any Android device on 4.4 KitKat (API 19) or above. You also get the surplus facility of built-in interaction to present the output to GIF and WebM. Additionally, the command line, the extended controls, and the Android Emulator all helps in accelerating the new screen record feature.
Virtual Scene Camera for Android Emulator
The Android Emulator also gets the Virtual Scene camera as an asset that helps to develop for ARCore, Google’s platform for building Augmented Reality experiences.
You need to adjust the emulator so that you can easily carry out your functions with respect to ARCore; APIs used for AR apps and insert the virtual scene bitmap pictures. You can even use it as a usual HAL3 compatible camera.
AMD Processor Support
The Android Emulator on Windows 10 also does support the AMD processors, which in earlier case was confined to emulating the software while running the emulator during running the Windows. So, if you get the AMD processor on the board, the performance speeds up.
ADB Connection Assistant
If you want to fix your problems related to Android ADB device connections, then this Studio 3.2 offers you a new assistant system. With the help of this ADB Connection Assistant, you can easily come across steps helpful in fixing the issues and get connected with the development machine. You can use the assistant either through the Run dialog or navigate the tools to reach Connection Assistant.
System Trace
This is a very important feature that helps in checking if or not your app is interacting well with the system resources by offering good details. It is available in the CPU Profiler. The details would generally include accurate timings and the durations of the thread states.
In addition, you can also find out where the hitch in the CPU lies and also allows the addition of custom trace events for the analysis. You have to profile your app in order to use this feature. First, click the CPU Profiler and go to the System Trace recording configuration.
Profiler Sessions
Android Studio 3.2 lets you save the Profiler data automatically named as sessions. It means you can visit again and check it later when Android Studio is open.
Besides, there is the facility of importing and exporting the CPU recordings and heaping up the dumps so that they can be analyzed later with different tools.
Automatic CPU Recording
Google in its latest Studio version has given the benefit of recording the CPU with the help of Debug API. Once the app is deployed, the CPU recording begins automatically when the app calls for the command startMethodTracing(String tracePath) for starting the recording activity and stopMethodTracing() for ending the recording task.
In addition, the CPU recording would also spontaneously start on the app start-up by using the Start Recording, which is a Method Trace for the Startup in the run configuration.
JNI Reference Tracking
This feature is actually quite useful for the developers using the C or C++ codes to develop the apps. It would help them to monitor the memory allocations of the JNI code available within Memory Profiler.
However, in order to stack the JNI reference or to get down to the allocation, you need to have a device running the Android 8.0 Oreo version or higher than that, equivalent to API 26. So, begin the memory profiler session and then choose the JNI Heap from the Live Allocation drop-down menu.
Conclusion
The new Android Studio 3.2 offers a spectrum of beneficial features and also adds to the performance improvement along with more stability.
As said before its available for the download and thus, it can be directly downloaded by visiting the site developer.android.com/studio. And yes, it’s applicable for all the Operating Systems namely Windows, Mac, and Linux respectively. However, in case you are already using the Android Studio, get the latest version by just checking for updates.
